
Most facility managers assume rainfall handles the heavy lifting when it comes to keeping solar panels clean. It does not. Understanding why large solar arrays need cleaning schedules starts with recognizing what soiling actually costs you, not just in visible grime, but in thermal drag, compounding yield loss, and financial exposure that grows every week you delay. This article breaks down the science, the site-specific variables, and the scheduling strategies that separate high-performing arrays from underperforming ones.
Table of Contents
- Key takeaways
- Why large solar arrays need cleaning schedules
- What drives soiling rates at your specific site
- Choosing the right cleaning methods and scheduling structure
- Using performance data to drive adaptive cleaning schedules
- My take on cleaning schedules and where operators go wrong
- Keep your array performing at its best
- FAQ
Key takeaways
| Point | Details |
|---|---|
| Soiling causes dual losses | Dirt reduces both light transmittance and increases cell temperature, compounding efficiency losses beyond what's visible. |
| Site conditions drive frequency | Cleaning frequency must match your environment. Arid, coastal, and urban sites each have different soiling rates and risk profiles. |
| Performance triggers beat calendars | Scheduling a cleaning when your performance ratio drops 5% or more is more cost-effective than fixed monthly or quarterly intervals. |
| Staggered cleaning protects output | Cleaning array zones in rotation keeps production online while maintenance proceeds, avoiding full-site downtime. |
| Data integration sharpens decisions | SCADA data, soiling sensors, and PR monitoring give you real-time justification for cleaning events and better yield forecasting. |
Why large solar arrays need cleaning schedules
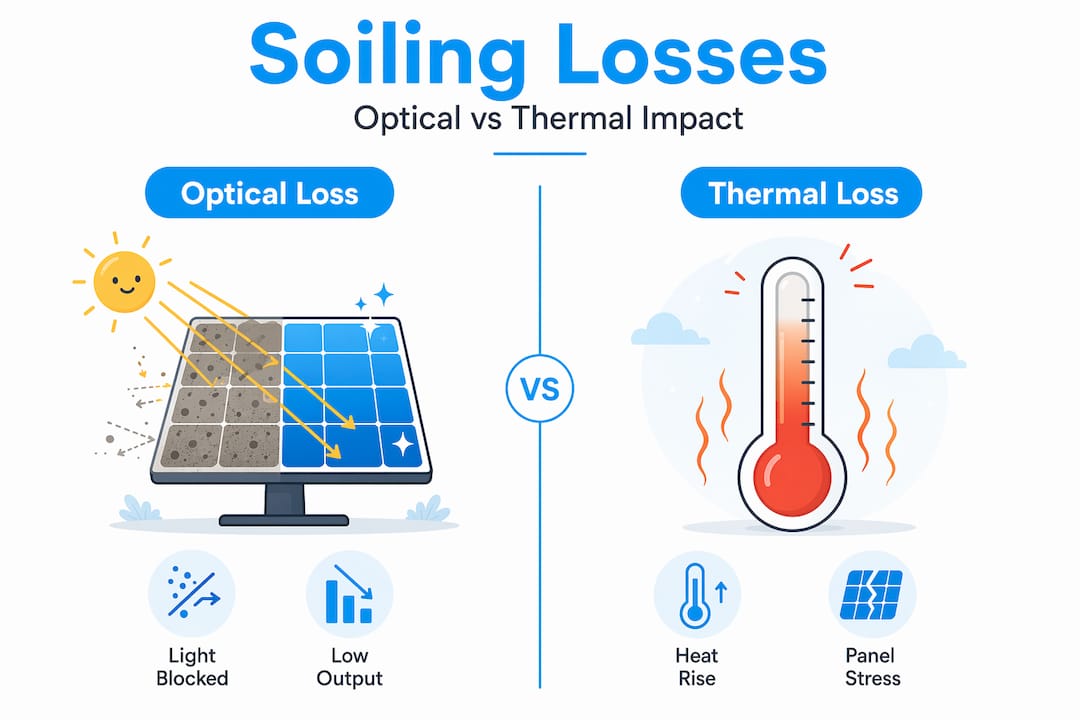
The first thing to understand is that soiling is not a cosmetic problem. Dust, pollen, bird droppings, and industrial particulate do two separate and compounding things to your panels. They block incoming irradiance, reducing the light that reaches your cells. And they act as a thermal blanket, trapping heat at the cell surface and driving up operating temperature.
Soiling losses average 3–5% globally, but in arid or dust-heavy regions, losses exceed 30%. For a large grid-tied array, that is not a rounding error. That is a material deviation from your projected yield.
The thermal side is often the piece operators miss entirely. Research shows that cell temperature rises up to 0.855°C depending on the thermophysical properties of the accumulated dust layer. Since every 1°C increase in cell temperature reduces output by approximately 0.4% for standard silicon modules, the heat penalty stacks on top of the optical penalty. One study found that annual energy loss can exceed 22% when thermal effects are included in the soiling model. For a 25kWp system, that translated to roughly US$1,900 in annual losses from soiling-induced heating alone.
| Loss type | Mechanism | Typical magnitude |
|---|---|---|
| Optical shading | Dust blocks light transmittance | 3–5% globally, 30%+ in arid regions |
| Thermal insulation | Dust layer raises cell temperature | Up to 0.855°C per layer |
| Combined annual loss | Both effects modeled together | Can exceed 22% with thermal included |
| Financial impact (25kWp) | Annual soiling-induced heating loss | ~US$1,900 per year |
Pro Tip: When calculating the ROI of your cleaning schedule, model both optical and thermal losses separately. Combining both in simulations produces a more accurate financial justification and often makes the case for more frequent cleaning than you originally budgeted for.
For large installations, the importance of cleaning solar panels is not debatable. It is a financial obligation to your investors and a technical obligation to your asset.
What drives soiling rates at your specific site
Not all dirt is the same, and not all sites accumulate it at the same rate. This is the part of the conversation where generic cleaning schedules break down completely. A fixed quarterly clean might be overkill for a temperate Midwest site and dangerously insufficient for a desert installation in the Southwest.
The key environmental drivers include:
- Dust and particulate density: Agricultural areas generate fine particulate from tillage and harvesting. Industrial zones deposit combustion byproducts. Both clog cell surfaces faster than urban environments with moderate vehicle traffic.
- Pollen seasons: In temperate climates, pollen surges in spring create rapid soiling events. A site in Wisconsin can lose measurable output in a matter of weeks during peak pollen season, even with regular rain.
- Humidity and moisture cycling: High-humidity environments create "cementation," where particulate bonds to the glass surface through moisture-adhesion cycles. Dry dusting becomes ineffective. Wet cleaning becomes necessary.
- Coastal salt spray: Sites within a few kilometers of the ocean accumulate conductive salt films. These are not just optical blockers. They create micro-current pathways that accelerate degradation beyond what standard soiling models predict.
- Panel tilt and array layout: Low-tilt panels collect more debris and drain less effectively after rain. Dense row spacing reduces self-cleaning from wind. Both factors increase your effective soiling rate even if the environmental conditions are identical to a neighboring site.
Operationally, your array layout determines how soiling distributes across zones. Shaded rows near tree lines or structures experience different soiling patterns than open-center rows. Performance losses depend on site conditions, which is precisely why a one-size schedule is a liability, not a plan.
Integrating soiling sensor data and SCADA output into your maintenance planning converts this complexity from a guessing game into a managed variable. When you have real data on where and how fast soiling accumulates, you can prioritize zones, time interventions accurately, and defend your maintenance decisions to ownership.

Choosing the right cleaning methods and scheduling structure
Cleaning method and scheduling structure are inseparable decisions. The wrong method on the wrong schedule either costs too much or leaves performance on the table.
Manual cleaning using deionized water and soft brushes remains the gold standard for precision. Deionized water leaves no mineral deposits, which matters because tap water cleaning on large arrays can trade a soiling problem for a spotting problem. Automated water-based systems with brush attachments scale well across large arrays and can restore over 95% system efficiency after heavy soiling. Robotic cleaners are gaining ground on utility-scale installations, particularly in water-scarce environments where dry-brush robots minimize water consumption.
The scheduling structure question is where most operators make costly mistakes.
| Approach | Trigger | Advantage | Risk |
|---|---|---|---|
| Calendar-based | Fixed dates (quarterly, monthly) | Simple to plan and budget | Cleans too early or too late relative to actual soiling |
| Performance-triggered | PR drops ≥5% vs. weather baseline | Optimizes timing and cost | Requires monitoring infrastructure |
| Hybrid | Calendar baseline plus PR trigger override | Balances simplicity with responsiveness | Slightly more management overhead |
| Staggered zone cleaning | Zone-by-zone rotation | Maintains partial production during cleaning | Requires zone-level monitoring to prioritize |
Industry standard cleaning frequency is 2 to 4 times per year, but that range is a starting point, not a specification. Sites in high-soiling environments with documented performance drops may require monthly interventions. Sites in cool, moderately humid climates with regular rainfall may manage with two well-timed cleans per year.
Large plants typically use staggered cleaning by zone to avoid taking the entire array offline simultaneously. This keeps generation revenue flowing during maintenance windows and allows cleaning crews to work systematically without rushing.
Pro Tip: Water quality matters as much as water volume. If your site uses municipal water for cleaning, test for mineral content first. Leaving calcium or magnesium deposits behind after a clean can reduce transmittance almost as fast as the original soiling. Our cleaning process uses professional-grade deionized water systems specifically to prevent this.
Using performance data to drive adaptive cleaning schedules
The single biggest upgrade most large array operators can make to their maintenance program is moving from calendar-triggered cleaning to data-triggered cleaning. The infrastructure to do this already exists on most commercial and utility-scale installations.
- Set a performance ratio baseline. Calculate your expected PR for each month based on irradiance, temperature, and system specifications. This is your clean-panel reference point.
- Monitor daily PR deviation. When actual PR falls more than 5% below your weather-adjusted baseline, you have a documented trigger for a cleaning event. PR drops of 5% or more are a recognized industry threshold that balances cost of cleaning against cost of continued yield loss.
- Layer in soiling sensor data. Dedicated soiling sensors measure transmittance loss in real time. Combined with your SCADA fault logs, they give you both the magnitude and the location of soiling impact across your array.
- Generate cleaning work orders from the data. When your system flags a zone for soiling, dispatch crews to that zone rather than cleaning the entire array. This reduces labor cost and minimizes downtime per cleaning event.
- Document and refine. Every cleaning event gives you a before-and-after PR comparison. Over two to three seasons, you will have site-specific data showing exactly how fast your array soils and what the yield recovery per clean looks like. That data directly improves your maintenance budget accuracy and your energy forecasting.
Cleaning schedules directly affect bankable yield accuracy and the financial risk profile of your asset. If your yield simulations are carrying 5 to 10% uncertainty from soiling, a data-driven solar array maintenance schedule is one of the most direct levers you have to reduce that uncertainty.
Check 8 signs you need a cleaning if you want a practical checklist for field-level inspection criteria alongside your monitoring data.
My take on cleaning schedules and where operators go wrong
I've seen the same pattern repeat across facilities of all sizes. The operator installs a solid monitoring system, tracks PR faithfully, and then cleans on a quarterly schedule regardless of what the data says. The monitoring becomes a reporting tool instead of a decision tool.
What I've learned is that the thermal component of soiling is the piece that changes people's minds most dramatically. When I walk operators through the math on temperature-driven losses, especially the finding that annual losses can include thousands of dollars in heat-penalty losses on top of the optical shading, the conversation about scheduling frequency shifts quickly. It stops being a maintenance cost discussion and becomes a revenue recovery discussion.
My experience also tells me that staggered zone cleaning is chronically underutilized. Operators treat cleaning as a single event because that is how it gets budgeted. But cleaning in rotation keeps your generation numbers healthier month over month, and it gives your monitoring data better resolution. When only one zone is dirty and the others are clean, your PR signals are much cleaner and easier to interpret.
The other mistake I see consistently is treating the solar array maintenance schedule as a fixed document rather than a living one. Your soiling rates will shift as surrounding land use changes, as vegetation matures, and as your panels age. The schedule that worked in year two of your installation may be systematically wrong by year five. Build in an annual review that compares actual vs. expected PR recovery per cleaning event. That review pays for itself.
— Marquis
Keep your array performing at its best
If this article has made one thing clear, it is that soiling is not a passive problem. It compounds over time across both optical and thermal dimensions, and a reactive approach to cleaning costs you yield that you never get back.

At Solaralchemist, we specialize in exactly this: professional, scheduled cleaning for large solar installations using deionized water systems and equipment designed for commercial-scale work. Our process protects your panels, honors manufacturer warranty standards, and keeps your performance ratio where it belongs. Whether you need a one-time recovery clean or a recurring maintenance program tailored to your site's soiling profile, we have the expertise to deliver measurable results. See our before and after results from real installations, or explore our services to get started.
FAQ
Why can't rainfall replace a scheduled cleaning?
Rainfall removes loose surface dust but cannot dissolve cemented particulate, pollen films, or salt deposits. In many environments, rain also introduces mineral deposits that reduce transmittance after drying.
How often should large solar arrays be cleaned?
Industry guidance points to 2 to 4 times per year as a baseline, but high-soiling sites may require monthly cleaning. The most reliable trigger is a performance ratio drop of 5% or more below your weather-adjusted baseline.
What is the financial impact of skipping cleaning?
For a 25kWp system, soiling-induced losses including thermal effects can total roughly US$1,900 annually. Utility-scale arrays scale this loss proportionally, making a missed cleaning event a significant revenue event.
What does staggered cleaning mean for large arrays?
Staggered cleaning divides your array into zones and cleans them in rotation rather than all at once. This approach keeps partial generation active during maintenance and reduces total downtime per cleaning cycle.
Does soiling affect panel temperature as well as light output?
Yes. Dust layers act as thermal insulation on the cell surface, raising temperatures up to 0.855°C per layer. Since higher cell temperature reduces output independent of light shading, soiling creates two separate efficiency penalties that both require cleaning to resolve.
Recommended
- When to Clean Solar Panels | 8 Signs You Need a Cleaning | Solar Alchemist
- Solar Panel Cleaning Before & After Results | Our Work | Solar Alchemist
- Solar Panel Cleaning Madison WI | Professional Solar Maintenance | Solar Alchemist
- Solar Panel Warranty Protection | Manufacturer Cleaning Guidelines | Solar Alchemist