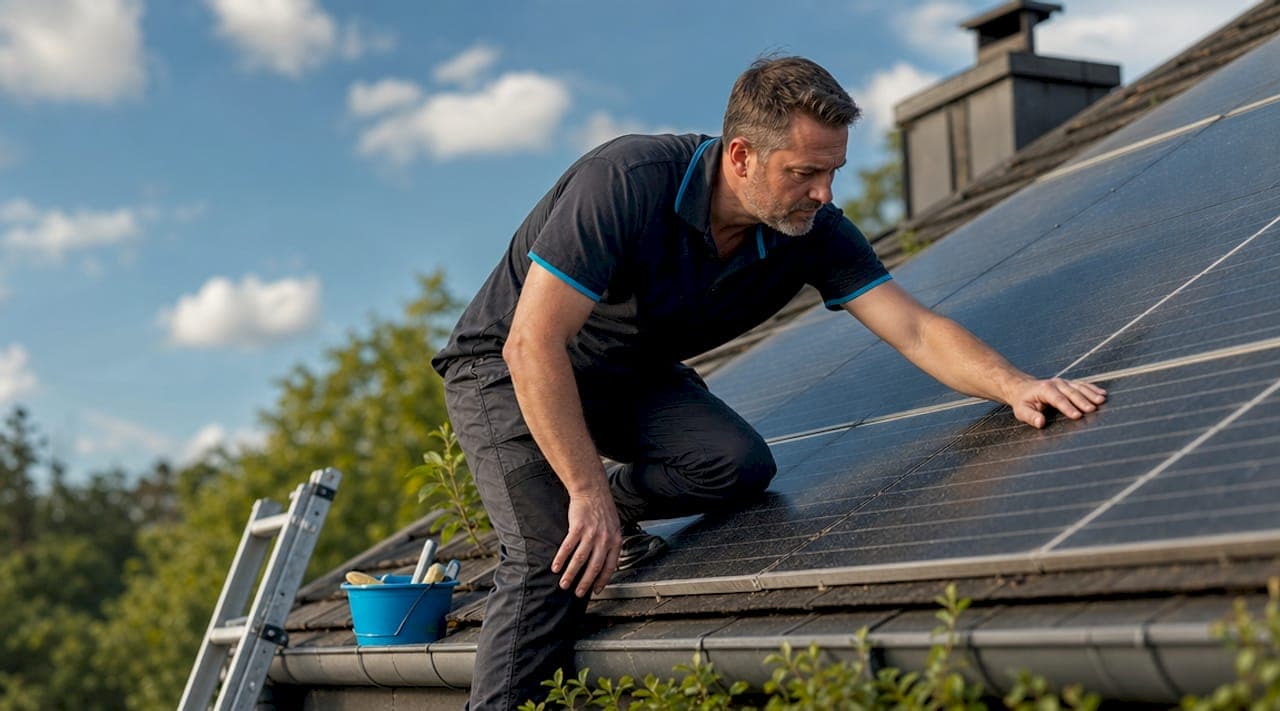
Dirty solar panels are the most common and most overlooked cause of preventable energy loss in residential solar systems. The signs solar panels need cleaning fall into two categories: measurable output drops you can track through your inverter or monitoring app, and visible fouling you can spot from the ground. Soiling causes 3 to 4% global PV energy loss on average, but individual systems in dusty or high-traffic bird zones can lose far more. Knowing which signals to watch for, and how to read them accurately, is the difference between a system running at full capacity and one quietly bleeding kilowatt-hours every day.
1. Signs solar panels need cleaning: a measurable output drop
A consistent, weather-matched production drop of 5% or more on clear days is the most reliable quantitative indicator your panels need attention. The method is straightforward: compare the last 7 days of inverter output to the same 7-day window four weeks earlier, excluding any cloudy days from both samples. If the gap holds at 5% or more across multiple clear days, you are looking at a soiling event, not a weather anomaly.

Performance ratio, or PR, gives you a more precise lens. PR measures actual output against what the system should produce given the irradiance it received. A PR drop of more than 3 percentage points versus your established baseline signals fouling rather than equipment degradation or seasonal tilt. Most modern inverters from brands like SolarEdge, Enphase, and Fronius display PR data directly in their monitoring dashboards.
Pro Tip: Filter your comparison windows to sunny days only. A single overcast day in your sample will skew the numbers and may cause you to either miss a real soiling event or schedule an unnecessary cleaning.
- Pull output data from your inverter app weekly, not monthly
- Compare same-season windows to avoid confusing tilt angle changes with soiling
- Flag any single day where output drops more than 10% below your clear-day average
2. Visible film, streaks, and spots on the panel surface
Visible soiling indicators include a hazy brown or gray film across the glass, dark streaks from bird droppings, and white mineral rings left by hard water deposits. These are the dirty solar panel signs most owners notice first, though they are often less accurate than output data for judging actual energy loss. A panel can look moderately dusty and still perform within 2% of its clean baseline. Conversely, a single bird dropping over a bypass diode can trigger disproportionate losses.
The most productive time for a visual check is early morning or late afternoon when the sun hits the panel surface at a low angle. Glare from a high sun washes out surface contamination and makes panels look cleaner than they are. Walk the perimeter of your array and look for:
- A uniform gray or brown haze covering most of the glass surface
- Dark circular or elongated spots consistent with bird droppings
- White or chalky rings, which indicate mineral deposits from sprinkler overspray or hard water
- Sticky yellow or green residue from pollen accumulation in spring
- Visible debris like leaves, seed pods, or construction dust along panel edges
Any combination of three or more of these visual cues for solar panel cleaning warrants a closer look at your output data to confirm whether cleaning is needed.
3. Rain did not clear the buildup
Rain removes light surface dust in many climates, but rain often fails to clear pollen, bird droppings, heavy dust, or industrial particulates. After a rain event, if your output does not recover to its pre-soiling baseline within one to two clear days, the contamination is too adhesive or concentrated for precipitation to handle. This is one of the clearest indicators solar panels need maintenance beyond passive weather cleaning.
The real truth about rain cleaning is that it works best on flat or low-tilt installations where water can pool and soak. On steeper pitches, water sheets off quickly and carries only the loosest particles with it. If your system sits at a tilt below 10 degrees, rain is even less effective, and post-rain output checks become a critical part of your monitoring routine.
4. One string or module is underperforming the rest
String-level monitoring showing one string significantly below the others is a strong signal of localized fouling rather than system-wide soiling. This matters because it changes your response. A single underperforming string often means one or two panels have concentrated contamination, like a cluster of bird droppings or a leaf pile, and spot cleaning is all you need. Full array cleaning in that scenario wastes time and money.
Enphase Enlighten and SolarEdge monitoring both offer module-level and string-level data that make this diagnosis straightforward. If one string consistently produces 8 to 15% less than adjacent strings on the same clear day, pull up the satellite or drone view of your array and look for visible fouling on those specific panels. Targeted spot cleaning rather than full cleaning is the cost-effective response to localized contamination.
5. Your environment puts you in a high-soiling zone
Where you live determines how fast your panels get dirty and how often you need to check for the indicators above. Desert, coastal, and industrial areas require cleaning every 2 to 3 months because soiling accumulates rapidly. Temperate regions with regular rainfall may only need annual cleaning. Understanding your environment is not optional context. It is the baseline for setting a realistic inspection schedule.
Here is how to think about your specific situation:
- Dry or desert climates (Arizona, Nevada, inland California): Dust accumulates weekly. Output monitoring should run on a two-week comparison cycle, and cleaning every 6 to 10 weeks is standard.
- Coastal areas (within 5 miles of saltwater): Salt aerosol deposits bond to glass and resist rain. Monthly visual checks and quarterly cleaning protect both output and panel longevity.
- Agricultural zones: Pollen seasons in spring and harvest dust in fall create two predictable high-soiling windows each year. Schedule cleanings immediately after each peak.
- Urban and industrial areas: Particulate pollution from traffic and manufacturing settles continuously. Bi-monthly output comparisons catch soiling before it compounds.
- Storm or wildfire events: Ash, mud, and debris from weather events are immediate cleaning triggers regardless of your normal schedule. Do not wait for your next scheduled check. Bi-annual cleaning is the residential average, but post-event cleaning is non-negotiable in fire-prone regions.
Pro Tip: Check your local air quality index (AQI) data from the EPA's AirNow platform. Sustained AQI readings above 100 in your area correlate with faster panel soiling and should trigger an output check within 48 hours of the event clearing.
6. Visual inspection and monitoring disagree
Visual inspection alone cannot reliably predict energy losses from soiling. This is the most important limitation to understand. A panel covered in a thin uniform dust layer may look dirty but lose only 2% output. A panel with two bird droppings over critical cell junctions may look mostly clean but lose 10% or more. The two methods measure different things, and neither is sufficient on its own.
| Method | Strength | Limitation |
|---|---|---|
| Visual inspection | Fast, no tools required, catches obvious fouling | Cannot quantify energy loss; misses thin uniform soiling |
| Output monitoring | Quantifies actual energy loss; weather-matched accuracy | Requires baseline data; cannot pinpoint location of fouling |
| Combined approach | Confirms cleaning need and locates fouling | Requires consistent data logging and periodic visual checks |
The combined approach is the standard Solaralchemist recommends to every system owner. Use output monitoring to confirm whether cleaning is worth doing, then use visual inspection to locate the fouling and decide between spot cleaning and full array service. Learning how to read solar production monitoring data takes less than an hour and pays for itself the first time it prevents an unnecessary service call.
7. It has been more than a year since the last cleaning
Time alone is a legitimate cleaning indicator for most residential systems. Most residential solar systems need cleaning 1 to 2 times per year, with monitoring guiding exact timing rather than a fixed calendar. If you cannot remember the last time your panels were cleaned and your monitoring data shows no dramatic drops, you may still have gradual soiling accumulation that has normalized in your baseline. Gradual soiling is the hardest to catch because your output never drops sharply. It just slowly drifts lower.
The soiling ratio (SR) framework addresses this directly. An SR of 95% means your panels produce 5% less than they would in a clean state. That loss compounds silently over months. A system that has not been cleaned in 18 months in a moderate-soiling environment may be running at SR 90 to 92% without triggering any single-day alert. Annual cleaning resets your baseline and protects the accuracy of all future monitoring comparisons.
Key takeaways
Reliable cleaning decisions require both output monitoring and visual inspection. Neither method alone gives you the full picture.
| Point | Details |
|---|---|
| Output drop threshold | A consistent 5% or more drop on clear days versus a 4-week prior window confirms soiling. |
| Visual check timing | Inspect panels at low sun angles in early morning or late afternoon for accurate fouling assessment. |
| Rain is not a substitute | Post-rain output recovery failure within two clear days means professional cleaning is needed. |
| String-level monitoring | One underperforming string points to localized fouling; spot cleaning is often sufficient. |
| Cleaning frequency | Desert, coastal, and industrial systems need cleaning every 2 to 3 months; temperate systems annually. |
What I've learned after years of watching panels underperform for the wrong reasons
The most common mistake I see residential solar owners make is treating cleaning like a chore they schedule by the calendar rather than a maintenance decision they make with data. Owners in Madison and Sun Prairie, Wisconsin often assume their panels stay clean because it rains regularly here. Rain handles light surface dust, but it does not touch pollen season in May, or the particulate fallout after a dry August. I have seen systems running at 88% of their clean-state output for six months because the owners assumed Wisconsin weather was doing the job.
The monitoring tools available today, specifically Enphase Enlighten and SolarEdge monitoring, make data-driven cleaning decisions accessible to anyone. You do not need to be an engineer. You need to check your app after a week of clear days and compare it to the same window a month ago. That one habit catches 90% of soiling events before they compound.
I also want to address the safety question directly. If your array is on a steep roof or a second-story installation, do not climb up there yourself. The energy savings from cleaning never justify a fall risk. Professional cleaning services use proper anchoring, deionized water systems, and soft-bristle equipment that will not scratch your glass. Newer droplet-based cleaning methods can remove up to 99.9% of contaminants using just 10% of the water volume traditional methods require. That matters both for water conservation and for avoiding the mineral deposits that hard water leaves behind.
My honest recommendation: set a monthly reminder to check your monitoring data, do a ground-level visual walk every 60 days, and call a professional when either signal tells you something is wrong.
— Marquis
Keep your system producing at its peak
If your output data or visual inspection is telling you it is time to act, Solaralchemist is ready to help. We serve homeowners and small businesses across Madison and Sun Prairie, WI with professional-grade deionized water cleaning systems that leave zero mineral residue and protect your panel surfaces. Our team uses both string-level monitoring review and on-site visual assessment before every service, so you only pay for cleaning your system actually needs. Check our detailed guide on when to clean solar panels to see all eight indicators we use to schedule service, or contact us directly to schedule an inspection.
FAQ
How do I know if my solar panels are dirty?
Compare your inverter output over the last 7 clear days to the same window four weeks earlier. A consistent drop of 5% or more on sunny days, combined with visible film or spots on the glass, confirms your panels need cleaning.
How often should solar panels be cleaned?
Most residential systems need cleaning 1 to 2 times per year, but systems in desert, coastal, or industrial areas require cleaning every 2 to 3 months. Monitoring data should guide exact timing rather than a fixed schedule.
Do dirty solar panels really affect performance?
Yes. Soiling causes 3 to 4% average energy loss globally, and individual systems with concentrated fouling like bird droppings can lose significantly more. A soiling ratio of 95% means you are permanently losing 5% of your potential output until the panels are cleaned.
Will rain clean my solar panels?
Rain removes light dust but fails to clear pollen, bird droppings, or heavy soiling. If your output does not recover to its pre-soiling baseline within two clear days after rain, the contamination requires manual cleaning.
What is the best way to check for localized panel fouling?
Use string-level or module-level monitoring from platforms like Enphase Enlighten or SolarEdge to identify which specific panels are underperforming. Then do a visual inspection of those panels to locate concentrated soiling and determine whether spot cleaning is sufficient.