
Home solar savings are the annual dollar amount you keep by generating your own electricity instead of buying it all from the grid. Calculating those savings requires more than a simple formula. You need your system size, local electricity rate, net metering policy, and fixed utility fees to get a number worth trusting. The Solar Energy Industries Association (SEIA) recognizes net metering as one of the most significant policy variables in any savings estimate. Get the inputs right, and homeowners can realistically project net savings of $12,000 to $75,000 over 25 years. Get them wrong, and you are either underselling a great investment or setting yourself up for disappointment.
How home solar savings are calculated: the core formula
The most accurate way to calculate solar savings uses this structure: (solar kWh consumed at home × retail electricity rate) + (exported solar kWh × export credit rate) + (any battery savings) minus fixed utility charges. Each variable in that formula carries real weight. Changing your electricity rate by just a few cents per kWh shifts your total savings by thousands of dollars over the system's life.
Estimating solar savings starts with your current electricity bill. Pull your annual kilowatt-hour (kWh) usage from 12 months of bills, then find your average rate per kWh. A typical solar system produces roughly 1,200 kWh per kW installed per year, so a 8 kW system generates about 9,600 kWh annually. That production number is your starting point, not your final savings number.

The table below shows each component, what it means, and why it matters.
| Component | What it means | Why it matters |
|---|---|---|
| Annual electricity usage (kWh) | Total kWh you consume each year | Sets the ceiling on how much solar can offset |
| Electricity rate ($/kWh) | What your utility charges per kWh | Higher rates mean higher savings per solar kWh |
| System production (kWh/year) | kWh your panels generate annually | Drives the gross savings before adjustments |
| Usable offset factor | Share of production that reduces your bill | Accounts for self-use vs. exported energy |
| Export credit rate | What your utility pays for excess solar | Usually lower than retail; reduces total savings |
| Fixed utility charges | Monthly fees that stay regardless of solar | Sets a floor on your bill; limits net savings |
Pro Tip: Pull your utility bills for all 12 months before running any estimate. Seasonal swings in usage can shift your annual savings projection by 15% or more.
How do you estimate the usable solar offset?
The usable solar offset is the share of your solar production that actually reduces your electricity bill. This number is almost never 100%. Some of your solar output flows to the grid during the day when you are at work or away from home. That exported energy earns a credit, but typically at a rate lower than what you pay to buy electricity.
Self-consumption of solar energy at home offsets electricity at the full retail rate. Exported energy, under most modern net metering policies, earns a credit at a lower wholesale or avoided-cost rate. The gap between those two rates is exactly why the usable offset factor matters so much in any realistic savings model. Simplified planning models typically apply a 70%–90% usable offset to total production to reflect this dynamic.
Several factors shift your usable offset up or down:
- Home occupancy during the day. Remote workers and retirees consume more solar directly, pushing the offset factor toward 90%.
- Battery storage. A home battery captures midday solar surplus and discharges it in the evening, converting exported energy into higher-value self-consumption.
- Load timing. Running dishwashers, laundry, and EV chargers during peak solar hours raises self-consumption without any hardware investment.
- System size relative to usage. Oversized systems export more, lowering the effective offset factor.
Pro Tip: Shift your largest appliances, like dishwashers and washing machines, to run between 10 AM and 2 PM. That single habit change can move your usable offset factor from 70% to 85% with no added cost.
Understanding your personal offset factor is one of the most underrated steps in calculating solar panel savings. Most online calculators assume a fixed offset, but your actual number depends on your household's daily rhythm.
What fixed charges reduce your total solar savings?
Fixed utility charges are the fees your utility bills every month regardless of how much electricity you use or generate. They do not disappear when you install solar. Grid connection fees typically run $25–$40 per month, which adds up to $300–$480 per year in unavoidable costs. That amount comes directly off your gross solar savings.
Common fixed charges include:
- Monthly service or connection fee. Covers the cost of maintaining your grid connection. Nearly universal across U.S. utilities.
- Minimum bill requirements. Some utilities require a minimum monthly payment even if your solar covers all consumption.
- Demand charges. Less common for residential customers, but some utilities charge based on your peak 15-minute usage in a month.
- Taxes and regulatory fees. State and local taxes applied to the base bill, not to usage, so solar does not reduce them.
Subtracting these fixed costs from your gross savings gives you net savings, which is the number that actually reflects your financial reality. A homeowner with $1,800 in gross annual savings and $420 in fixed annual fees nets $1,380. That is still a strong return, but it is meaningfully different from the headline number.
Pro Tip: Call your utility or log into your online account and look for a line item labeled "customer charge," "service charge," or "distribution charge." Add those up across 12 months before finalizing your savings estimate.
How do incentives and payback periods factor into the calculation?
Incentives reduce the net cost of your solar system, which directly shortens the payback period. The payback period is the number of years your cumulative savings equal your out-of-pocket system cost. Residential solar payback periods in the U.S. range from 6 to 13 years in 2026, depending on state incentives, electricity rates, and system costs. High-rate states like New York, New Jersey, California, and Massachusetts see paybacks as short as 5–7 years.
The federal investment tax credit (ITC) was a major driver of shorter payback periods for years. The federal ITC expired on December 31, 2025, shifting typical payback periods 3–5 years longer for systems installed in 2026 and beyond. Homeowners now need to lean harder on state-level incentives, utility rebates, and local programs to close that gap.
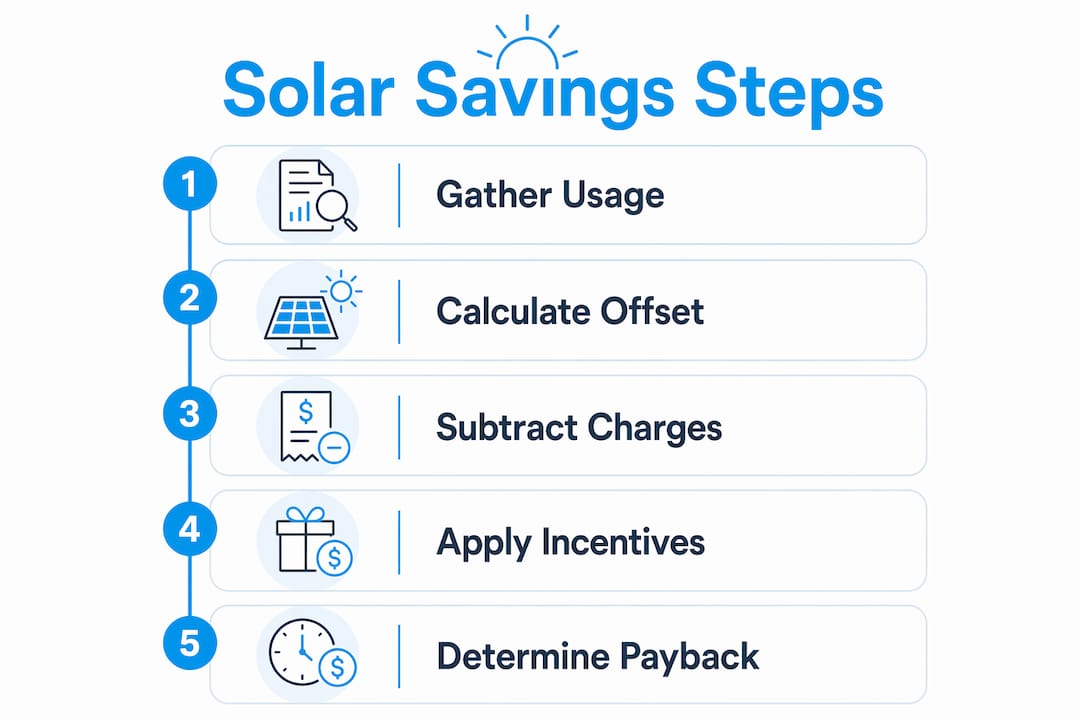
Here is how to think through the full financial picture in sequence:
- Calculate gross system cost. Get quotes and identify the total installed price before any incentives.
- Subtract all applicable incentives. State tax credits, utility rebates, and any local grants reduce your net cost.
- Estimate annual net savings. Use the formula from the first section, including the usable offset and fixed fee deductions.
- Divide net cost by annual savings. The result is your payback period in years.
- Project long-term savings beyond payback. This is where the real financial story lives.
Solar panels provide essentially free electricity for 15–20 years after the payback period ends, acting as a direct hedge against rising utility rates. The savings beyond payback are not a bonus. They are the primary financial case for going solar.
Long-term solar savings beyond the payback period are the strongest argument for installation. Electricity rates have risen consistently over decades. A homeowner who pays off their system in year 9 and then runs it for another 16 years collects those savings at whatever rate the utility charges in the future, not today's rate. That compounding effect is what makes solar a genuine financial asset, not just an environmental choice.
Local electricity rate trends matter enormously here. Wisconsin homeowners, for example, face utility rate increases that compound over time. Every cent per kWh the utility raises rates adds directly to the value of every solar kWh your system produces. That is why understanding net metering policies and local rate trajectories is non-negotiable for accurate long-term projections.
Key Takeaways
Accurate solar savings estimates require combining your usable solar offset, local electricity rate, and fixed utility charges into a single net figure rather than relying on gross production numbers alone.
| Point | Details |
|---|---|
| Use the full formula | Combine self-consumed kWh at retail rate, exported kWh at credit rate, and subtract fixed fees. |
| Apply a realistic offset factor | Use 70%–90% usable offset to account for exported energy credited at lower rates. |
| Account for fixed charges | Grid connection fees of $25–$40/month set a floor on your bill that solar cannot eliminate. |
| Recalculate after ITC expiration | Federal ITC expired in 2025, extending payback periods 3–5 years for 2026 installations. |
| Focus on post-payback savings | The 15–20 years of free electricity after payback is the strongest financial argument for solar. |
The number most homeowners get wrong
Most solar estimates I see focus on gross production and stop there. That is the single biggest mistake in any savings calculation. A system that produces 10,000 kWh per year does not save you 10,000 kWh worth of electricity costs. It saves you the value of the portion you actually use at home, plus a lower credit for what you export, minus the fees your utility charges no matter what.
The fixed fee issue catches homeowners off guard more than anything else. People expect a near-zero electric bill and then get a $35 monthly statement and feel misled. That $35 is not a failure of solar. It is a structural feature of utility billing that no solar system can eliminate. Understanding that upfront sets realistic expectations and protects the relationship between homeowners and their investment.
The other misconception worth addressing: solar does not need to eliminate your entire electricity bill to be financially worthwhile. Solar becomes beneficial where electricity rates exceed $0.13/kWh. Most U.S. homeowners pay well above that threshold. Partial offset at a strong retail rate still delivers a compelling return.
Treat your savings estimate as a planning tool with assumptions baked in, not a contract. Your actual savings will vary based on weather, changes in your usage, and utility rate adjustments. Build in a conservative buffer, understand your local net metering rules, and revisit the calculation every few years as your utility rates change.
— Marquis
Solaralchemist keeps your savings on track
Calculating your solar savings is only half the equation. Your panels have to perform at the level those calculations assumed.

Dirty panels lose output quietly. Dust, pollen, bird droppings, and hard water deposits accumulate across seasons and reduce the energy your system actually delivers. Solaralchemist uses professional-grade deionized water systems and specialized equipment to restore panels to full production without risking surface damage. Serving Madison and surrounding Wisconsin communities, the team brings local knowledge of seasonal soiling patterns that generic cleaning schedules miss. Check when to clean your solar panels to see the signs that your system needs attention and how a cleaning schedule protects the savings you calculated.
FAQ
How is the solar savings formula structured?
Solar savings equal (solar kWh used at home × retail rate) plus (exported kWh × export credit rate) plus battery savings, minus fixed utility charges. This formula accounts for both self-consumed and exported energy at their respective values.
What is a realistic payback period for solar in 2026?
Payback periods range from 6 to 13 years for most U.S. homeowners, with high-rate states seeing 5–7 years. The expiration of the federal ITC in 2025 has pushed these timelines 3–5 years longer for new installations.
Why can't solar eliminate my entire electric bill?
Fixed utility charges such as connection fees and minimum bill requirements remain regardless of solar production. These fees typically total $300–$480 per year and create a billing floor that solar cannot offset.
What is the usable solar offset and why does it matter?
The usable offset is the share of your solar production that reduces your bill at the full retail rate. Exported energy earns a lower credit rate, so most accurate models apply a 70%–90% offset factor to total production rather than counting all output as full-value savings.
Does solar still make financial sense without the federal tax credit?
Solar remains worthwhile where electricity rates exceed $0.13/kWh, which covers most U.S. markets. State incentives, utility rebates, and long-term rate protection replace much of the value the federal ITC previously provided.