
Solar cleaning ROI is the net financial return you get by comparing what you spend on cleaning against the energy value you recover from cleaner, more efficient panels. For most panel owners, this calculation determines whether cleaning is a smart investment or an unnecessary expense. The formula for how solar cleaning roi is calculated pulls together four variables: your system's annual energy output, your soiling loss percentage, your local electricity rate, and your total cleaning cost. Get these numbers right, and you know exactly when cleaning pays and when it doesn't.
What is the standard formula for solar cleaning ROI?
The ROI of solar cleaning follows a five-step process. Each step builds on the last, so skipping one produces a misleading result.
- Estimate your annual clean-panel production. Start with your system's rated output in kilowatt-hours per year. Your inverter dashboard or utility bill history gives you this number.
- Calculate your soiling loss percentage. Soiling loss is the share of production you're losing to dirt, dust, pollen, or bird droppings. Monitoring software can measure this directly. Without monitoring, regional averages apply, but they're less reliable.
- Convert lost kWh to dollars. Multiply your annual production by the soiling loss percentage, then multiply that figure by your local electricity rate. A California homeowner paying $0.30 per kWh who loses 5% of 10,000 kWh annually loses $150 per year in energy value.
- Subtract your cleaning cost. Deduct what you pay for professional or DIY cleaning from the recovered revenue figure. The result is your net financial benefit.
- Divide net benefit by cleaning cost. That ratio, expressed as a percentage, is your ROI. A $150 energy recovery on a $50 cleaning job produces a 200% ROI.
The break-even point occurs when recovered electricity value equals or exceeds cleaning cost. In high-rate states like California, break-even happens at just 2–3% soiling. In low-rate states, you may need 10–15% soiling before cleaning pencils out financially.
The payback period is a related but different metric. ROI tells you the return on a single cleaning. Payback period tells you how many months of energy savings cover the cleaning cost. For commercial systems, payback periods typically run 1–5 months. That's a fast return by any standard.

Pro Tip: Run your ROI calculation before scheduling a cleaning, not after. If your soiling loss in dollars doesn't exceed your cleaning quote, the job isn't financially justified yet.
Which factors influence solar cleaning ROI?
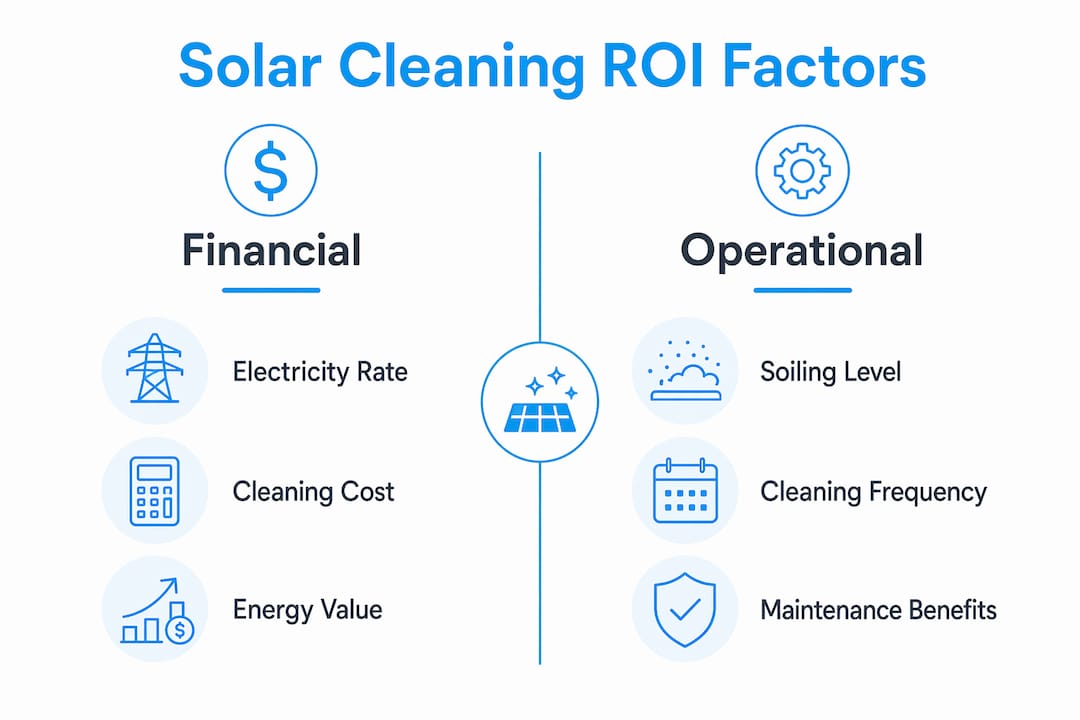
The inputs to your ROI formula aren't fixed. Several variables shift the result significantly depending on your location, system, and environment.
- System size. Larger systems amplify both losses and gains. A 100 kW commercial array losing 5% to soiling loses far more in dollar terms than a 10 kW residential system at the same soiling rate.
- Soiling type and severity. Dust and pollen reduce output gradually. Bird droppings cause localized shading that hits harder per square inch. Structured cleaning improves energy output by 6–10% in dusty environments. That range matters when you're building a business case.
- Local electricity rate. Your rate is the multiplier in the formula. Higher rates make cleaning more profitable at lower soiling thresholds. Feed-in tariffs, where utilities pay you for exported power, function the same way.
- Cleaning cost structure. DIY cleaning costs less upfront but carries risks including panel scratching and voided warranties. Professional services charge more per visit but often offer contract pricing that reduces per-cleaning cost over time.
- Rainfall and climate. Frequent rain acts as a free rinse cycle. In Madison, Wisconsin, seasonal rainfall reduces soiling accumulation compared to arid regions like Arizona or Southern California, where soiling builds faster and cleaning frequency needs to increase.
- Water costs. Large-scale cleaning requires significant water volume. Municipal water costs run $3–5 per 1,000 gallons, while trucked water reaches $0.10–0.50 per gallon. For utility-scale projects, water is a real line item in the cleaning cost analysis.
- Monitoring accuracy. Inaccurate production data produces inaccurate ROI figures. Systems without monitoring rely on assumptions, which can overstate or understate the financial gain from cleaning.
Pro Tip: Track your local electricity rate quarterly. Utility rates change, and a rate increase can flip a marginal cleaning ROI from unprofitable to clearly worthwhile without any change to your panels.
How can you verify the accuracy of your ROI calculation?
Generic industry averages for soiling loss are a starting point, not a final answer. Site-specific monitoring outperforms fixed schedules in mild climates because it captures what's actually happening on your roof, not what happens on average roofs elsewhere.
Here's how to verify your numbers:
- Use before-and-after production data. Record your system's output for a comparable period before cleaning and after cleaning. Match the comparison to similar irradiance conditions, ideally the same time of day and season.
- Apply the reference inverter method. If your system has multiple inverters or strings, compare a cleaned section against an uncleaned section under identical sunlight. The production gap reveals the actual soiling impact.
- Track performance ratio over time. Performance ratio measures actual output against theoretical maximum output. A declining ratio signals soiling or other losses. Most modern inverter platforms, including SolarEdge and Enphase, report this metric automatically.
- Set threshold alerts. Configure your monitoring system to flag when production drops a set percentage below your baseline. This replaces calendar-based cleaning with performance-based cleaning, which is more financially sound.
- Avoid visual assessment alone. Cosmetic dirt doesn't always mean economic dirt. Panels can look dusty while losing only 1–2% output, which may not justify cleaning costs in low-rate areas.
Professional assessment adds value when your monitoring data is ambiguous or when you're evaluating a new cleaning contract. A qualified technician can identify shading patterns, hotspots, and soiling types that monitoring software alone may not distinguish.
What practical steps maximize your solar cleaning ROI?
Maximizing the financial gain from solar cleaning comes down to making decisions based on data, not habit or marketing.
Evaluate your electricity rate and environment first. Your rate determines how much each recovered kWh is worth. Your local pollution environment determines how fast soiling accumulates. These two factors set the baseline for every ROI decision you make.
Clean only when the numbers support it. Monitoring-triggered cleaning outperforms fixed schedules because it prevents unnecessary service calls. If your system shows a 1% production drop in a $0.12 per kWh market, cleaning probably costs more than it recovers. If it shows an 8% drop in a $0.28 per kWh market, cleaning is clearly worth it.
Compare contract structures carefully. Fixed-schedule subscriptions benefit service providers when cleaning happens before soiling reaches economic thresholds. Fixed cleaning subscriptions can mainly benefit service providers without improving ROI for the panel owner. On-demand or performance-triggered contracts align the service provider's incentive with yours.
Factor in non-energy benefits. Cleaning preserves manufacturer warranties, reduces fire risk from debris accumulation, and supports insurance compliance on commercial properties. These benefits don't show up in a basic ROI formula but they represent real financial protection. You can explore cleaning cost savings in detail to understand the full financial picture.
Avoid over-servicing. Cleaning more often than soiling warrants adds cost without adding proportional recovery. The goal is the highest net benefit per cleaning event, not the highest number of cleaning events per year.
How does ROI differ between residential and commercial solar?
The core formula is the same for residential and commercial systems, but the scale and financial framing differ substantially.
| Factor | Residential (10–20 kW) | Commercial (100 kW and above) |
|---|---|---|
| Typical soiling loss | 2–8% annually | 5–15% annually |
| Average payback period | 6–18 months | 1–5 months |
| Cleaning cost per kW | Higher per unit | Lower per unit at scale |
| ROI range | Variable, often marginal | 150–870% in polluted areas |
| Financial framing | Personal energy savings | Operational expense decision |
Pollution causes 5–15% efficiency losses for commercial solar installations. At that scale, professional cleaning yields ROIs between 150–870%. Those numbers reflect the compounding effect of large system size, higher soiling severity, and bulk contract pricing.
Commercial managers frame cleaning as an operational expense decision. The comparison isn't cleaning cost versus energy savings. It's cleaning cost versus the cost of buying replacement energy at retail prices when efficiency drops. That framing makes the financial case stronger and easier to justify in budget reviews.
Residential owners face a different reality. Small residential systems in mild climates often have cleaning costs that exceed energy gains. For these owners, cleaning is better treated as selective maintenance triggered by monitoring data rather than a routine service with a guaranteed return. You can review the commercial ROI formulas separately to see how the math scales up.
Key takeaways
Solar cleaning ROI is only positive when the financial value of recovered energy exceeds the total cost of cleaning, calculated with site-specific data rather than industry averages.
| Point | Details |
|---|---|
| Core ROI formula | Subtract cleaning cost from recovered energy value, then divide by cleaning cost for your ROI percentage. |
| Break-even threshold varies | High-rate states reach break-even at 2–3% soiling; low-rate states need 10–15% soiling to justify cleaning. |
| Commercial ROI is stronger | Commercial systems see payback in 1–5 months and ROI up to 870% in polluted environments. |
| Monitoring beats calendars | Performance-triggered cleaning prevents unnecessary service calls and protects net financial benefit. |
| Residential owners should be selective | Small systems in mild climates often see marginal returns; clean only when monitoring confirms economic loss. |
The number that changes everything
I've reviewed a lot of ROI claims in this industry, and the one that surprises most panel owners is how much the local electricity rate moves the math. Two homeowners with identical 10 kW systems and identical 5% soiling losses can have completely opposite cleaning ROI outcomes based solely on what their utility charges per kilowatt-hour.
The owner paying $0.30 per kWh recovers $150 in lost energy annually. A $60 cleaning job returns 150% ROI. The owner paying $0.12 per kWh recovers only $60 in lost energy. That same $60 cleaning job returns 0% ROI. Same panels, same dirt, opposite financial outcomes.
What I find most owners get wrong is treating cleaning as a maintenance ritual rather than a financial decision. They clean because it feels right, not because the numbers say it's right. That instinct costs money. The owners who get the best returns are the ones who check their monitoring data first, calculate the recovery value, and then decide. It takes ten minutes and it's the difference between a profitable cleaning and an expensive habit.
The technology to make this easy already exists. SolarEdge, Enphase, and most modern inverter platforms give you the production data you need. The only missing piece is the habit of using it before you schedule a service call rather than after. For large arrays, the case for performance-based cleaning schedules is even stronger given the volume of money at stake.
— Marquis
Get a cleaning that actually pays for itself
Solaralchemist serves solar panel owners across Madison, Wisconsin and surrounding communities with professional-grade cleaning built around one goal: measurable energy recovery. We use deionized water systems and specialized equipment that clean without scratching, streaking, or voiding your warranty.
Every job we do is tied to your system's actual performance, not a fixed calendar. If your panels don't need cleaning yet, we'll tell you. If they do, we'll show you the before-and-after production data to confirm the financial gain. Visit our solar cleaning timing guide to see the eight signs that cleaning has crossed into ROI-positive territory for your system. You can also learn more about our approach on the Solaralchemist about page.
FAQ
How is solar panel cleaning ROI calculated?
Solar cleaning ROI is calculated by subtracting your annual cleaning cost from the dollar value of recovered energy, then dividing that net benefit by the cleaning cost. The recovered energy value equals your soiling loss percentage multiplied by annual production in kWh, multiplied by your electricity rate.
What soiling level makes cleaning worth it?
Break-even occurs at 2–3% soiling for homeowners paying $0.30 per kWh, and at 10–15% soiling for those in low-rate states. Your electricity rate is the primary factor that sets this threshold.
Is professional cleaning better than DIY for ROI?
Professional cleaning preserves warranties, uses proper equipment, and avoids panel damage that DIY methods risk. For commercial systems, professional contracts also deliver bulk pricing that improves per-cleaning ROI significantly.
How often should i clean my solar panels?
Clean based on monitoring data, not a fixed schedule. When your system's performance ratio drops measurably below baseline, calculate whether the recovery value exceeds the cleaning cost before booking a service.
Do residential systems get the same ROI as commercial?
No. Commercial systems typically see ROI between 150–870% with payback in 1–5 months due to scale and higher soiling severity. Residential systems in mild climates often see marginal or negative ROI unless monitoring confirms significant soiling losses.