
Commercial solar maintenance cost savings are the measurable reductions in operating expenses and lost-revenue events achieved through optimized cleaning, inspection, and contract management of photovoltaic systems. For business owners and facility managers, these savings are not theoretical. Soiling alone reduces annual PV generation by 3 to 5% on average, with losses exceeding 30% in harsh climates, costing the global industry billions each year. The difference between a system that pays for itself on schedule and one that quietly underperforms comes down to how well you manage operations and maintenance (O&M) costs against recovered energy yield.
1. How soiling drives commercial solar maintenance costs
Soiling is the single largest controllable drag on commercial solar output, and its financial impact is routinely underestimated. Soiling causes 4 to 7% global energy losses across PV portfolios, and the IEA-PVPS has confirmed that excessive cleaning wastes operating expenditure just as surely as neglect does. That means the cost problem runs in both directions.
Not all soiling behaves the same way. The industry distinguishes between removable soiling, which rain and light cleaning can address, and persistent soiling, which bonds chemically or physically to panel surfaces and requires mechanical intervention. European soiling losses can be 5.5 times higher when persistent soiling is properly modeled, compared to older estimates that assumed rain would handle most of the problem. Facilities that budget maintenance based on generic soiling assumptions are systematically under-budgeting or over-cleaning.
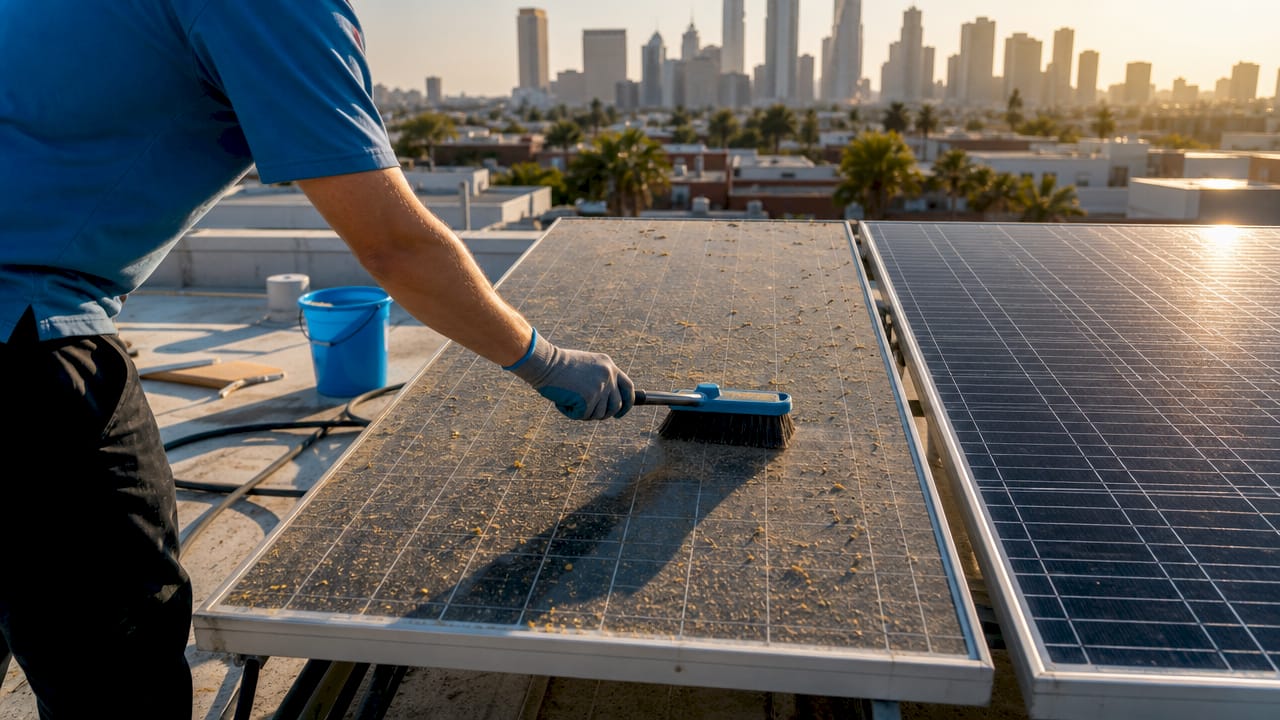
Site-specific variability is the key factor most facility managers miss. A rooftop array in an urban industrial zone accumulates soiling at a fundamentally different rate than a ground-mount system in a rural agricultural area. Fixed generic soiling assumptions mislead both budgeting and maintenance planning, according to PV Tech's analysis. Understanding your site's actual soiling profile is the first step toward genuine commercial solar upkeep expense reduction.
2. Optimizing cleaning schedules through data-driven monitoring
The most expensive cleaning schedule is the one set by the calendar rather than by system performance. Fixed-interval cleaning, say every 90 days regardless of conditions, guarantees you will sometimes clean panels that don't need it and delay cleaning panels that do. Both outcomes cost money.
Monitoring technologies now make site-specific soiling measurement practical at commercial scale. Performance ratio (PR) sensors, irradiance meters, and string-level monitoring platforms can detect soiling-driven output drops in near real time. Operators can optimize cleaning schedules by simulating site-specific soiling profiles to balance maintenance costs against energy yield recovery, a method that consistently outperforms fixed-interval approaches. The simulation compares the cost of a cleaning visit against the dollar value of generation recovered, and it triggers a cleaning only when the math favors action.
The practical steps for data-driven schedule optimization look like this:
- Establish a baseline performance ratio for your array under clean conditions.
- Log PR continuously and calculate the rolling deviation from baseline.
- Model the daily revenue loss from the current soiling level.
- Compare that loss against the cost of a cleaning visit.
- Schedule cleaning when cumulative lost revenue exceeds cleaning cost by your target margin.
This approach also accounts for seasonal maintenance schedule variations, since pollen season, harvest dust, and winter grime accumulate at different rates and require different responses.
Pro Tip: Use a 5% performance ratio drop from your clean baseline as your economic cleaning trigger. At that threshold, the cost of cleaning almost always recovers more in generation value than it spends in labor and water.
3. Commercial solar inspection services compared by cost and value
Inspections are where facility managers most often overspend or underspend, usually because they treat all inspection types as interchangeable. They are not.
| Inspection type | Typical cost | Defect detection depth | Best use case |
|---|---|---|---|
| Basic drone flyover | $100 to $200 per MW | Visual damage, soiling patterns | Annual overview, large arrays |
| IEC 62446-3 thermal imaging | $350 to $500+ per MW | Hot spots, cell failures, junction issues | Post-installation, warranty claims |
| String-level electrical testing | Varies by array size | Degradation, mismatch, wiring faults | Performance investigations |
| Ground-based visual inspection | Low cost | Physical damage, mounting issues | Quarterly walk-throughs |
IEC 62446-3-compliant thermal inspections cost $350 to $500+ per MW, while basic drone flyovers run $100 to $200 per MW. The compliance-grade inspection is not always necessary every year, but skipping it entirely creates warranty and insurance exposure that costs far more when a claim arises.
Drone technology has changed the cost-benefit calculation for large commercial arrays. A drone can cover a 1 MW rooftop system in a fraction of the time a ground crew requires, reducing labor costs and minimizing roof traffic that risks membrane damage. The real savings come from integrating inspection data into your maintenance management system so that defects found during a flyover automatically generate work orders rather than sitting in a PDF report no one acts on.
Pro Tip: Log every defect found during inspections with a timestamp, location, and resolution record. Practitioners who maintain historical defect logs reduce repeat repair visits by identifying recurring failure patterns and addressing root causes rather than symptoms.
4. How commercial solar maintenance contracts protect operational budgets
A maintenance contract is not a commodity purchase. The structure of the agreement determines whether your system performs to its financial model or quietly bleeds revenue through untracked degradation and slow fault response.
Full-service commercial O&M contracts typically include:
- Quarterly inspections covering mounting hardware, wiring, and inverter status
- Scheduled cleaning triggered by performance data or seasonal soiling events
- Annual infrared thermal imaging to catch hot spots before they become failures
- Inverter OEM servicing per manufacturer requirements to protect warranty coverage
- Fault response SLAs requiring technician dispatch within 48 hours of an alert
Full-service O&M with fault response SLAs under 48 hours represents the industry standard for commercial installations, according to Oxmaint's commercial buildings maintenance guide. Contracts without defined response time commitments expose you to days or weeks of lost generation during inverter faults.
The contract's service level agreement (SLA) is where most of the financial protection lives. A well-written SLA specifies minimum performance ratios, maximum response times, and reporting intervals. Computerized maintenance management system (CMMS) software, used by leading O&M vendors, tracks every work order, inspection result, and KPI against contract terms. This creates accountability that informal service relationships cannot replicate. When comparing commercial solar maintenance contracts, the SLA terms matter more than the headline price per visit.
5. KPIs and technology tools that maximize maintenance savings
Reactive maintenance, fixing problems after they cause losses, is the most expensive way to run a commercial solar asset. The shift to proactive maintenance depends on three KPIs tracked consistently: performance ratio, system availability, and mean time to repair (MTTR).
Performance ratio measures system conversion efficiency and serves as the primary trigger for maintenance work orders. A PR drop of more than 5% from baseline signals either soiling, a fault, or degradation that requires investigation. Availability tracks the percentage of time the system is capable of generating at rated capacity. MTTR captures how quickly faults are resolved once detected.
The financial stakes of MTTR are concrete. Each hour of inverter fault restoration can correspond to roughly $1,250 per day per 1 MW of lost revenue. For a 500 kW commercial rooftop, a two-day inverter fault costs approximately $1,250 in unrecovered generation. That figure dwarfs the cost of a monitoring subscription that would have caught the fault within hours.
The biggest hidden maintenance savings come from minimizing downtime through monitoring and fast technician response, not from cleaning frequency alone.
Software platforms from vendors like Solaralchemist's preferred monitoring partners automate work order generation when PR drops below threshold, alert on-call technicians via SMS or app notification, and log resolution times against SLA commitments. This creates a closed loop where every fault is detected, assigned, resolved, and recorded. Historical defect data from that loop then informs future maintenance planning, reducing the cost of repeat visits to the same failure points.
6. Reducing solar maintenance costs through large array scheduling
Large commercial arrays above 100 kW face a specific cost challenge: the labor and logistics of maintenance scale faster than the array size if scheduling is not carefully managed. A large solar array cleaning schedule that groups cleaning, inspection, and inverter servicing into coordinated visits cuts mobilization costs significantly compared to scheduling each service separately.
Coordinated visit planning works by aligning the cleaning cycle with the quarterly inspection window. When a technician is already on site for an inspection, adding a cleaning visit costs a fraction of a standalone mobilization. For facilities with multiple buildings or ground-mount sections, routing optimization across sections in a single visit can reduce per-visit labor costs by 20 to 30% compared to uncoordinated scheduling.
The same logic applies to annual maintenance planning for Wisconsin facilities, where winter conditions compress the effective cleaning season into spring and fall windows. Scheduling thermal imaging, cleaning, and inverter checks in a single spring mobilization captures the full benefit of each service while minimizing total site visits per year.
7. Common mistakes that eliminate solar maintenance savings
Most commercial solar systems underperform their financial models not because of equipment failure but because of avoidable maintenance errors. The most costly mistakes follow predictable patterns.
Cleaning panels with hard tap water leaves mineral deposits that reduce transmittance and accelerate surface degradation. Professional-grade deionized water systems, used by Solaralchemist, eliminate mineral spotting entirely and produce measurably cleaner surfaces than tap water methods. Facilities that allow contractors to use unfiltered water are paying for cleaning that partially undoes itself.
Ignoring common solar panel cleaning mistakes like abrasive tools, high-pressure water, and cleaning during peak sun hours causes micro-scratches and thermal shock that degrade panel efficiency over time. Each of those errors adds long-term cost that never appears on a single service invoice but accumulates across the system's 25-year life.
Over-relying on rain as a cleaning mechanism is the most widespread and expensive mistake at persistent soiling sites. Rain removes loose dust but does not address the bonded particulates that rain alone cannot maintain performance against, according to EPJ Photovoltaics research. Facilities in agricultural areas near Madison, Wisconsin, where pollen and crop dust create persistent soiling, need scheduled mechanical cleaning regardless of rainfall.
Key takeaways
Commercial solar maintenance cost savings depend on matching cleaning frequency, inspection depth, and contract terms to your site's actual performance data rather than generic schedules.
| Point | Details |
|---|---|
| Soiling loss is site-specific | Generic soiling assumptions cause over-cleaning or under-cleaning; model your actual site profile. |
| Data triggers beat fixed schedules | Use a 5% performance ratio drop as your economic cleaning trigger to avoid unnecessary visits. |
| Inspection type determines ROI | IEC 62446-3 thermal inspections cost more but protect warranty claims; basic flyovers suit annual overviews. |
| Contract SLAs protect revenue | Fault response commitments under 48 hours prevent $1,250+ per day per MW in lost generation. |
| MTTR is the biggest cost lever | Minimizing downtime through fast fault response saves more than optimizing cleaning frequency alone. |
What I've learned about where the real savings actually hide
Most facility managers I talk to focus their cost-reduction efforts on cleaning contracts. They compare prices per visit, negotiate frequency, and feel satisfied when they land a lower rate. That focus is understandable, but it targets the smaller half of the savings opportunity.
The larger savings live in downtime reduction. A single two-day inverter fault on a 500 kW system costs more in lost generation than three months of cleaning visits. Yet most commercial operators have no automated fault detection, no defined response SLA, and no historical fault log. They find out about inverter problems when someone notices the utility bill hasn't changed.
I've also seen the persistent soiling problem cause real budget damage at facilities that assumed Wisconsin's spring rains would handle panel cleanliness. They don't. Pollen and agricultural dust in Dane County bond to panel surfaces in ways that rainfall cannot remove. The operators who discovered this learned it through a PR audit, not through a vendor recommendation.
My honest recommendation: before you negotiate your next cleaning contract, spend 30 days logging your system's performance ratio against irradiance data. That baseline will tell you more about your actual maintenance needs than any vendor's standard service schedule. Evidence-backed, site-specific planning is the only approach that consistently closes the gap between your system's financial model and its real-world output.
— Marquis
Protect your solar investment with expert maintenance
If your commercial array is running below its performance baseline, the cause is almost always soiling, a fault, or a maintenance gap that a structured service plan would have caught earlier.
Solaralchemist provides tailored cleaning schedules built around your system's actual performance data, using professional-grade deionized water systems that leave no mineral residue and cause zero surface damage. Every service visit is coordinated to minimize mobilization costs and maximize recovered generation. If you're not sure whether your panels need attention right now, start with 8 signs you need a cleaning to assess your system's current condition. For facilities in the Madison area, Solaralchemist's Madison solar cleaning service delivers the site-specific maintenance your investment requires.
FAQ
What is a realistic commercial solar maintenance cost savings percentage?
Well-managed commercial systems recover 3 to 7% of annual generation through optimized cleaning and fault management, translating directly to reduced operating costs and improved ROI. The exact figure depends on site soiling rates, system size, and contract structure.
How often should commercial solar panels be cleaned?
Cleaning frequency should be triggered by performance ratio drops rather than fixed intervals. A 5% PR deviation from your clean baseline is the standard economic trigger, though persistent soiling sites may require more frequent intervention regardless of PR data.
What do commercial solar maintenance contracts typically include?
Full-service O&M contracts include quarterly inspections, scheduled cleaning, annual infrared thermal imaging, inverter OEM servicing, and fault response SLAs requiring technician dispatch within 48 hours of an alert.
Are drone inspections worth the cost for commercial solar?
Drone inspections at $100 to $200 per MW reduce labor costs significantly on large arrays and generate defect data that feeds directly into maintenance work orders. IEC 62446-3 thermal inspections at $350 to $500+ per MW are worth the premium when warranty claims or insurance documentation are at stake.
How does performance ratio monitoring reduce maintenance costs?
Performance ratio tracking enables automated work order generation when output drops below threshold, catching faults within hours rather than days. Given that each hour of inverter downtime can cost roughly $1,250 per day per 1 MW, early detection through PR monitoring delivers measurable financial returns.