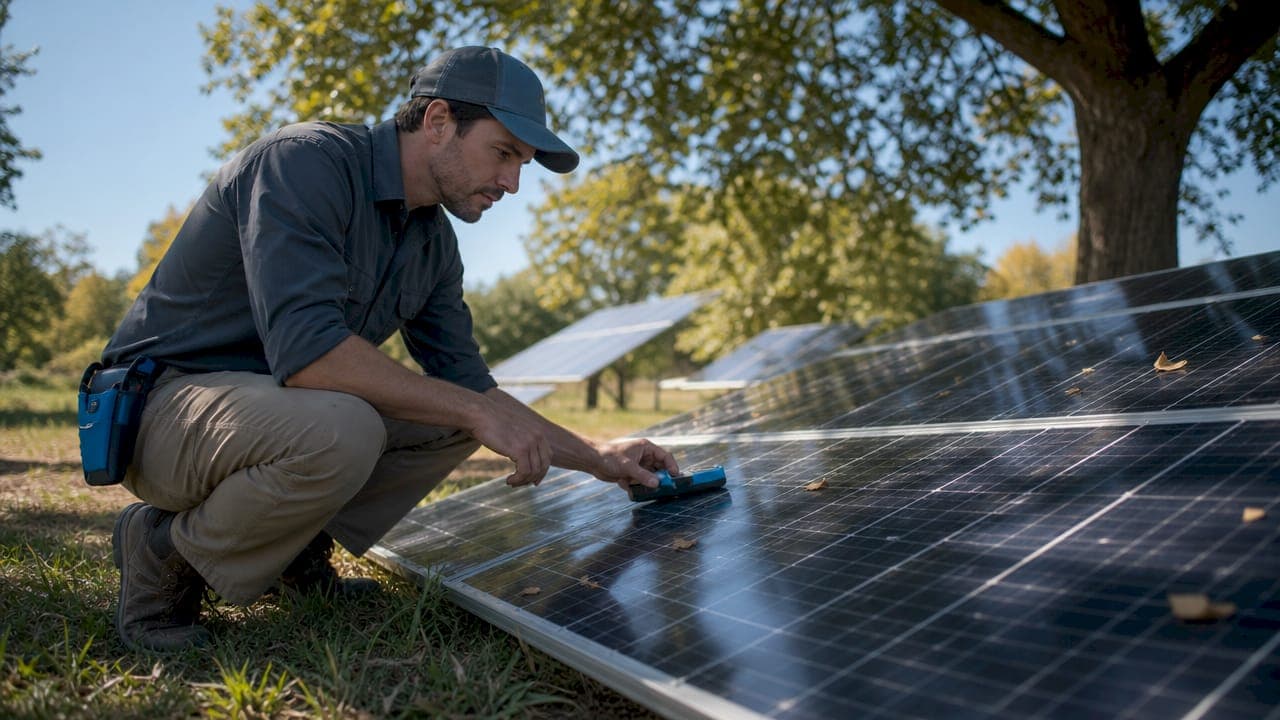
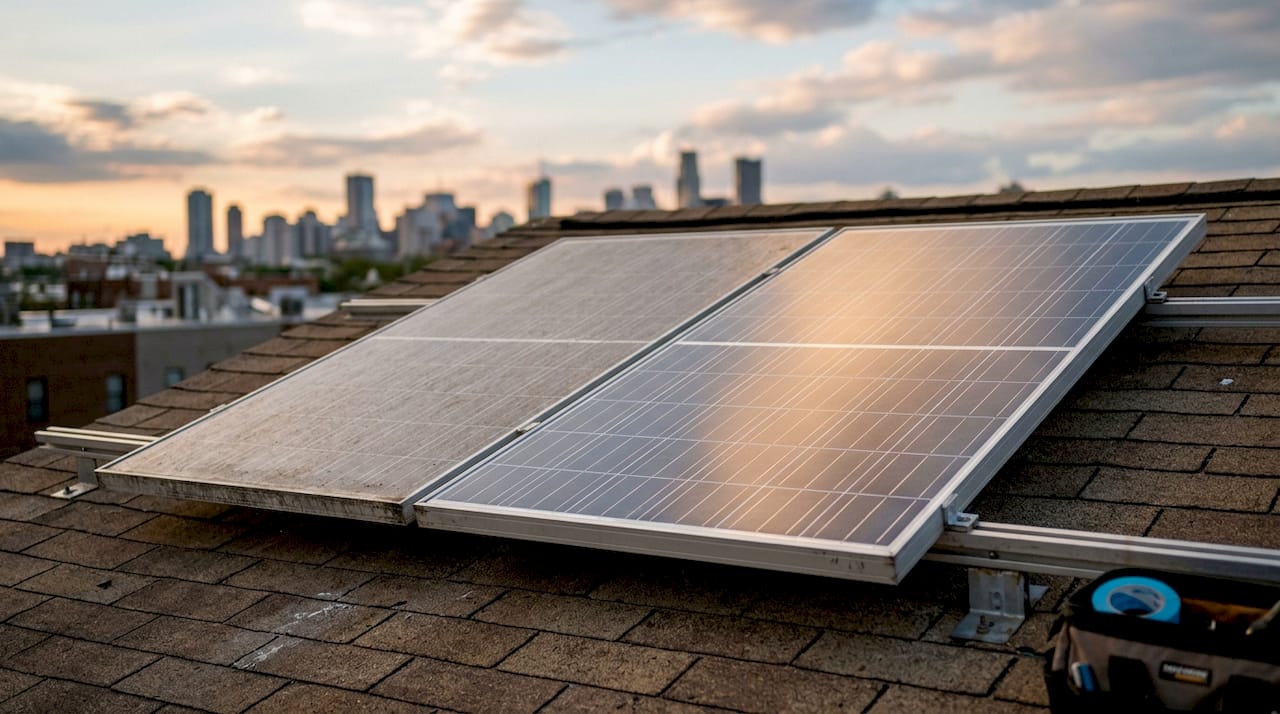
Solar panel soiling is defined as the accumulation of dust, pollen, bird droppings, and other debris on panel glass that reduces light transmission and cuts power output. Soiling losses account for 3–4% of global photovoltaic production, with residential systems losing anywhere from 5–25% depending on how much dirt has built up. The industry term for quantifying this loss is the soiling ratio (SR), and understanding how solar panel surface dirt is measured gives you the data you need to clean at the right time, not just on a fixed calendar schedule.
How solar panel surface dirt is measured using the soiling ratio
The soiling ratio is the core metric for quantifying dirt on solar panels. It compares the power output of a dirty panel to the output of an identical clean panel under the same conditions. An SR of 0.95 means the dirty panel produces 5% less power than it should. That 5% gap is recoverable through cleaning, which is why dirt losses are reversible and distinct from permanent panel degradation.
The reference module method
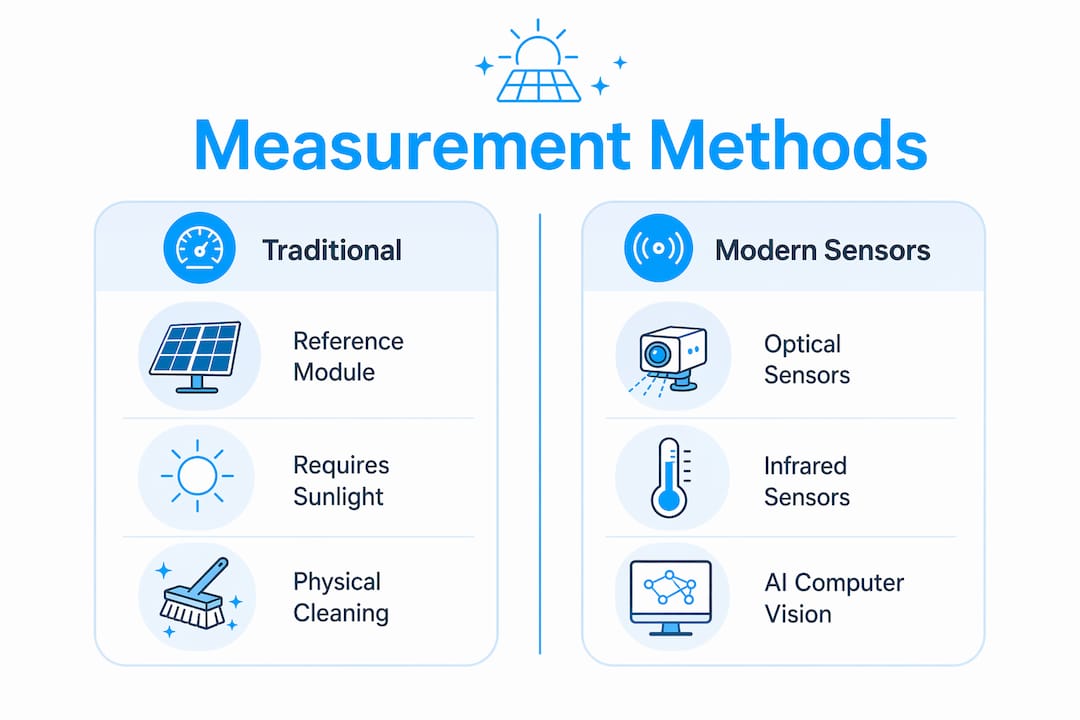
The traditional approach uses two identical solar reference modules mounted side by side at the same tilt and azimuth as the main array. One module is kept clean by regular wiping. The other is left exposed to natural soiling. The ratio of their outputs gives you the SR in real time.
IEC Standard 61724-1 mandates that soiling ratio data be logged at least every minute for Class A monitoring compliance when losses exceed 2%. That minute-level resolution matters because soiling rates change with wind, rain, and seasonal pollen cycles. A single daily reading misses those fluctuations entirely.
Setting up this method correctly takes discipline. Here is what the process looks like in practice:
- Mount both modules on the same date. Exposure history must match from day one. A module installed six months later will have a different baseline, making the SR comparison unreliable.
- Clean the reference module on a fixed schedule. Weekly cleaning is the standard for most climates. Skipping even one cleaning cycle introduces error into every subsequent reading.
- Align both modules precisely. Even a few degrees of tilt difference changes how light scatters off the surface, which distorts the output comparison.
- Log data at minute intervals. Averaging over longer periods masks short-term soiling events like a dust storm or a week of dry weather.
- Cross-check against irradiance data. A pyranometer reading confirms that output differences come from soiling, not from passing clouds or shading.
Pro Tip: Clean the reference module early in the morning before sunrise. Cleaning during peak sun hours can temporarily alter the module's temperature and introduce a short-term output spike that skews your SR reading.
The reference module method is proven and widely used, but it has real limitations. Misalignment and angle-dependent light scattering are the two biggest sources of error. When the sun is low on the horizon, light hits the two modules at slightly different angles, and even a small physical offset produces a measurable output difference that has nothing to do with dirt.
What optical and infrared sensors offer over traditional methods
Optical soiling measurement (OSM) solves the angle problem entirely. These sensors measure the reflection of an infrared pulse from the underside of a glass surface coated with whatever has settled on it. The measurement is internal, so it does not depend on sunlight angle or intensity. Optical systems provide 24/7 measurement independent of external light conditions, which means you get valid SR data at night, on cloudy days, and in the early morning hours when reference modules produce no usable output.
Key advantages of optical soiling sensors over reference modules:
- No sunlight required. Readings are valid around the clock, giving you continuous soiling trend data.
- No alignment sensitivity. The infrared pulse travels internally, so physical tilt differences between the sensor and the array do not introduce error.
- Lower maintenance burden. Reference modules need frequent cleaning to stay accurate. Optical sensors do not have a "clean reference" component that requires manual upkeep.
- Faster response to soiling events. A dust storm at 2:00 AM shows up in the data immediately, not at the next sunrise.
| Feature | Reference module method | Optical soiling sensor |
|---|---|---|
| Sunlight required | Yes | No |
| Angle sensitivity | High | None |
| Maintenance need | High (frequent cleaning) | Low |
| Data continuity | Daytime only | 24/7 |
| Installation complexity | Moderate | Low |
Calibration is still required for optical sensors. Each sensor needs to be calibrated against the local dust profile, because the optical properties of desert sand differ from those of agricultural pollen or urban particulate matter. A sensor calibrated for Arizona conditions will read differently in Madison, Wisconsin, where pollen and road salt are the dominant contaminants.
Pro Tip: Request a site-specific calibration report from your sensor supplier before installation. Generic factory calibration values can underestimate soiling by several percentage points in regions with heavy biological contamination like pollen or bird activity.
Can AI and computer vision detect dirt on solar panels?
Computer vision is the newest category of soiling measurement, and it works differently from both reference modules and optical sensors. AI classifiers trained on RGB images analyze photos of panel surfaces and flag areas of visible contamination. The most accurate models use a Vision Transformer architecture, which processes the image in patches rather than as a whole, making it better at detecting uneven soiling patterns like bird droppings or edge accumulation.
The critical insight is that image data alone is not enough. Computer vision models must combine visual data with concurrent energy output to distinguish dirt-related losses from equipment aging or shading from nearby trees. A panel that looks dirty but is producing normal output may have transparent dust that does not block light significantly. A panel that looks clean but underperforms may have a failing bypass diode.
For residential owners, the appeal of this approach is cost. Computer vision enables soiling detection without expensive industrial sensors. A standard camera mounted near the array, paired with monitoring software, can flag cleaning needs based on visual change over time. The technology is not yet as accurate as a calibrated optical sensor, but it is improving rapidly and works well as a supplementary signal.
Limitations worth knowing:
- Image quality degrades in low light, rain, and heavy overcast conditions.
- Models trained on one panel type may not generalize well to different glass coatings or frame colors.
- Shading from nearby objects creates visual patterns that some classifiers misread as dirt.
- Energy output integration requires a monitoring inverter with data export capability.
Practical best practices for deploying soiling measurement
Getting accurate soiling data in the field depends as much on installation discipline as on sensor technology. The single most common mistake is installing sensors after the array has already been operating for months. Sensors installed later than the PV modules have a baseline mismatch that makes their data unreliable for capacity testing and long-term performance evaluation.
Best practices for field deployment:
- Install sensors on the same day as the modules. Concurrent installation is the only way to guarantee that the sensor and the array share the same exposure history from the start.
- Position sensors to match array tilt and orientation exactly. Even small deviations compound over time into meaningful measurement error.
- Set cleaning triggers based on SR thresholds, not fixed dates. An SR below 0.95 is a common trigger point for utility-scale systems. Residential owners may choose a lower threshold based on their local soiling rate.
- Log weather data alongside soiling data. Rainfall events often reset soiling naturally. Knowing when rain occurred helps you separate natural cleaning from actual dirt accumulation trends.
- Review data monthly for drift. Sensors can shift calibration over time. A slow upward drift in the SR reading during a dry period with no rain is a sign the sensor needs recalibration, not that the panels are getting cleaner.
Pro Tip: Cross-reference your soiling ratio data with your inverter's production logs. If SR stays above 0.97 but production is down, the problem is not dirt. You may have a shading issue, a failing string, or inverter clipping that cleaning will not fix.
Understanding why panels get dirty in your specific location also shapes how you deploy measurement. A system near agricultural fields in Wisconsin accumulates pollen and crop dust at a very different rate than a rooftop system in a suburban neighborhood. Measurement data lets you build a soiling profile specific to your site, which makes every future cleaning decision more defensible.
Key Takeaways
Accurate soiling measurement is the foundation of cost-effective solar panel maintenance, and the soiling ratio is the metric that makes it possible.
| Point | Details |
|---|---|
| Soiling ratio is the core metric | SR compares dirty panel output to clean panel output; values below 1.0 indicate recoverable losses. |
| IEC 61724-1 sets the standard | Class A monitoring requires SR data logged at least every minute when losses exceed 2%. |
| Optical sensors outperform reference modules | Infrared optical sensors measure 24/7 without sunlight and eliminate angle-related errors. |
| AI vision adds a low-cost option | Computer vision combined with energy output data detects soiling without industrial sensors. |
| Install sensors from day one | Sensors deployed after the array starts operating produce unreliable baseline data for capacity testing. |
The measurement gap most owners never close
I have seen a lot of solar arrays in Wisconsin where the owner had no idea how much production they were losing to dirt. Not because they were careless, but because nobody told them measurement was even an option. The default assumption is that rain cleans panels well enough, and a fixed annual cleaning is sufficient. That assumption costs real money.
What changed my thinking was seeing soiling ratio data from a residential system near a cornfield outside Madison. The SR dropped below 0.85 during late summer pollination, which is a 15% output loss, and it stayed there for six weeks because the owner was waiting for the scheduled fall cleaning. Six weeks at 15% loss on a 10 kW system is not a rounding error.
The technology to catch that kind of loss early is now accessible to residential owners, not just utility-scale operators. A basic optical sensor costs a fraction of what a year of lost production is worth. Computer vision tools are getting good enough to serve as a first alert system even without dedicated hardware. The barrier is not cost anymore. The barrier is awareness.
My advice: treat soiling measurement as part of your system from the first day of operation. Read about solar panel soiling effects before you decide on a cleaning schedule. And do not wait for a visible layer of grime to tell you something is wrong. By the time dirt is obvious to the eye, you have already lost weeks of production.
— Marquis
Solaralchemist turns measurement data into real production gains
Knowing your soiling ratio is only half the equation. Acting on it with the right cleaning method is what actually restores your output.

Solaralchemist serves solar panel owners and facility managers across Madison, Wisconsin and the surrounding region. The team uses professional-grade deionized water systems that remove contaminants without leaving mineral deposits that accelerate future soiling. When your SR data or cleaning indicators signal it is time to act, Solaralchemist delivers a cleaning that fully restores your panels to baseline output. Contact Solaralchemist to schedule a service visit timed to your soiling data, not a generic calendar date.
FAQ
What is the soiling ratio in solar panels?
The soiling ratio (SR) is the ratio of a dirty panel's power output to the output of an identical clean panel under the same conditions. An SR of 0.90 means the dirty panel produces 10% less power than it should.
How often should soiling be measured?
IEC 61724-1 requires minute-level data logging for Class A solar monitoring compliance. Residential owners without dedicated sensors should check production data weekly and look for unexplained output drops.
Can rain clean solar panels enough to skip measurement?
Rain removes loose dust but leaves behind pollen, bird droppings, and mineral deposits. Dirt losses of 5–25% are common even in regions with regular rainfall, which is why measurement remains necessary regardless of precipitation.
Do I need industrial sensors to measure dirt on my panels?
No. Computer vision tools using standard cameras and energy output data can detect soiling on residential systems without industrial hardware, though optical sensors provide higher accuracy and 24/7 data continuity.
What triggers a cleaning based on soiling data?
Utility-scale operators typically clean when the SR drops below 0.95. Residential owners can use the same threshold or set a custom trigger based on their local soiling rate and the cost of a cleaning visit versus the value of recovered production.